Campaign statistics allow you to measure the performance of your emails and better understand the behavior of your recipients. They are an essential tool for identifying what works, spotting areas for improvement, and optimizing your future sends.
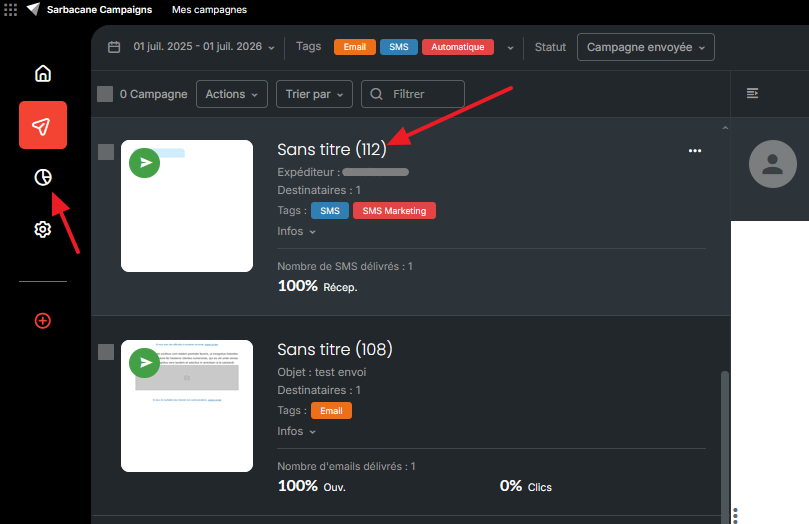
To do this, go to the "campaigns" tab where two options are available to you.
Either from the sent campaign by clicking on its title to access the "Statistics" tab.
Or from the "Statistics" tab directly by then selecting the desired campaign.
Data is updated progressively as recipients interact with your email (opens, clicks, unsubscribes, etc.).
Let us now explore each tab in the statistics section.
From the results tab, you will be able to see the overall statistics of your campaign by:
Chart
Enabling analysis of opening or click peaks
Distribution
Enabling consultation of active, inactive, unsubscribed, NPAI and complaint contacts from this campaign
Note: Please note that you have the ability to follow up with your contacts or create a list for each of these categories.
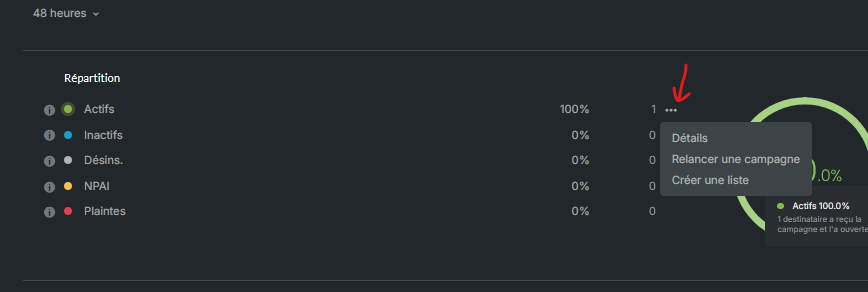
Active: this rate indicates the number of contacts who have opened and/or clicked on your communication.
Inactive: this rate indicates the number of contacts who received your campaign but did not click or open it.
Unsubscribed: this rate indicates the number of recipients who unsubscribed after receiving your campaign. A low unsubscribe rate is generally a sign that your communications remain relevant to your audience.
NPAI: NPAI corresponds to emails that could not be delivered. Two types of bounces are distinguished; only NPAI (Hard Bounce) are recorded here: invalid address, non-existent address, or incorrect domain.
Complaints: this statistic corresponds to recipients who have reported your email as spam. Although this number often remains low, it is important to monitor it, as a high complaint rate can damage your sender reputation and deliverability.
Openers / Clickers / Reactivity Rate
Enabling the counting of clicks or clickers, opens and openers, and viewing details as well as the reactivity rate.
Reactivity (or Click-to-Open Rate) measures the ratio between clicks and opens.
Unlike the click-through rate, which is calculated across all delivered emails, reactivity allows you to evaluate the interest generated by your content among people who actually opened your campaign.
For example:
1,000 emails delivered > 300 opens > 60 clickers = The reactivity is 20% (60 clicks for 300 openers).
This metric is particularly useful for measuring the quality of your email content.
Reading Time
Sarbacane also estimates the average reading time of your campaign. This data allows you to determine whether your recipients simply opened the email or whether they actually took the time to review its content.
Desktop vs Mobile
Enabling the definition of devices used to read your sends. However, please note that since the advent of VPNs, this information may be unusable.
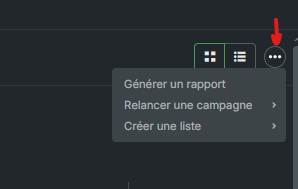
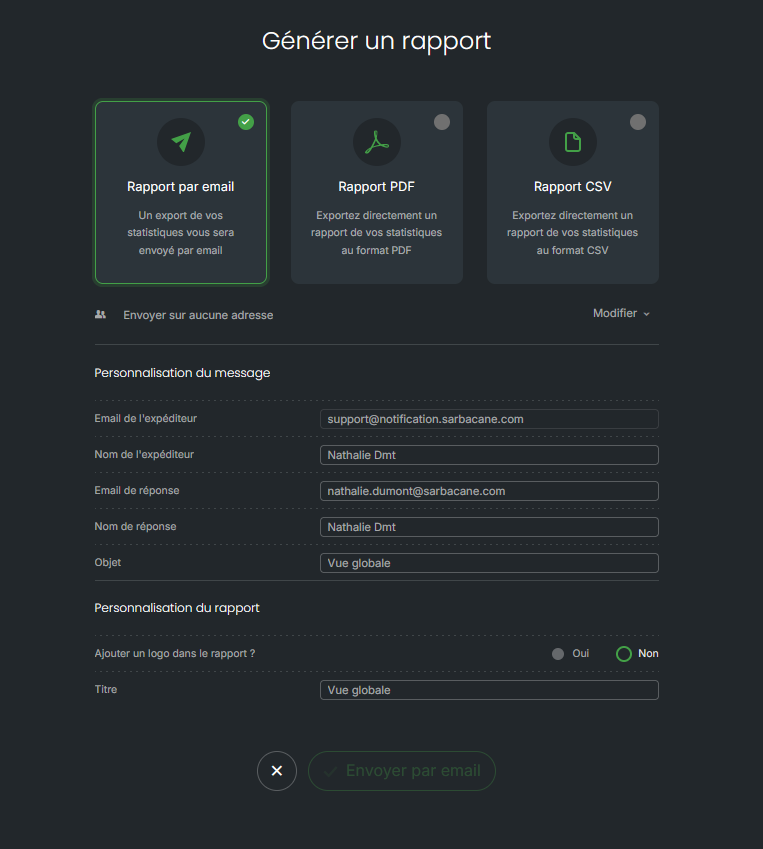
It is also possible to generate reports from the global view (all campaigns, only certain ones you preselect) or from a single campaign.
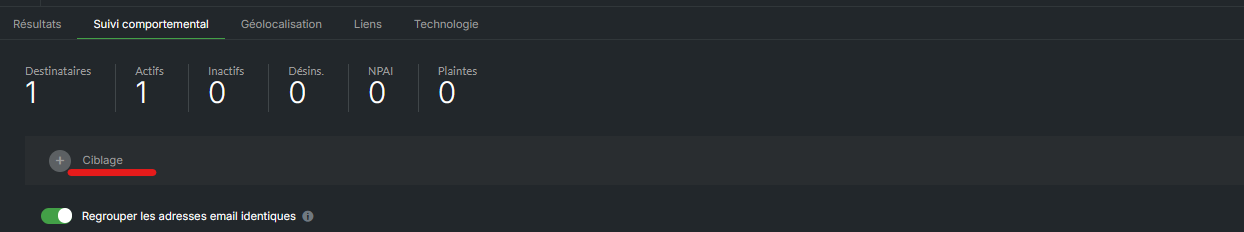
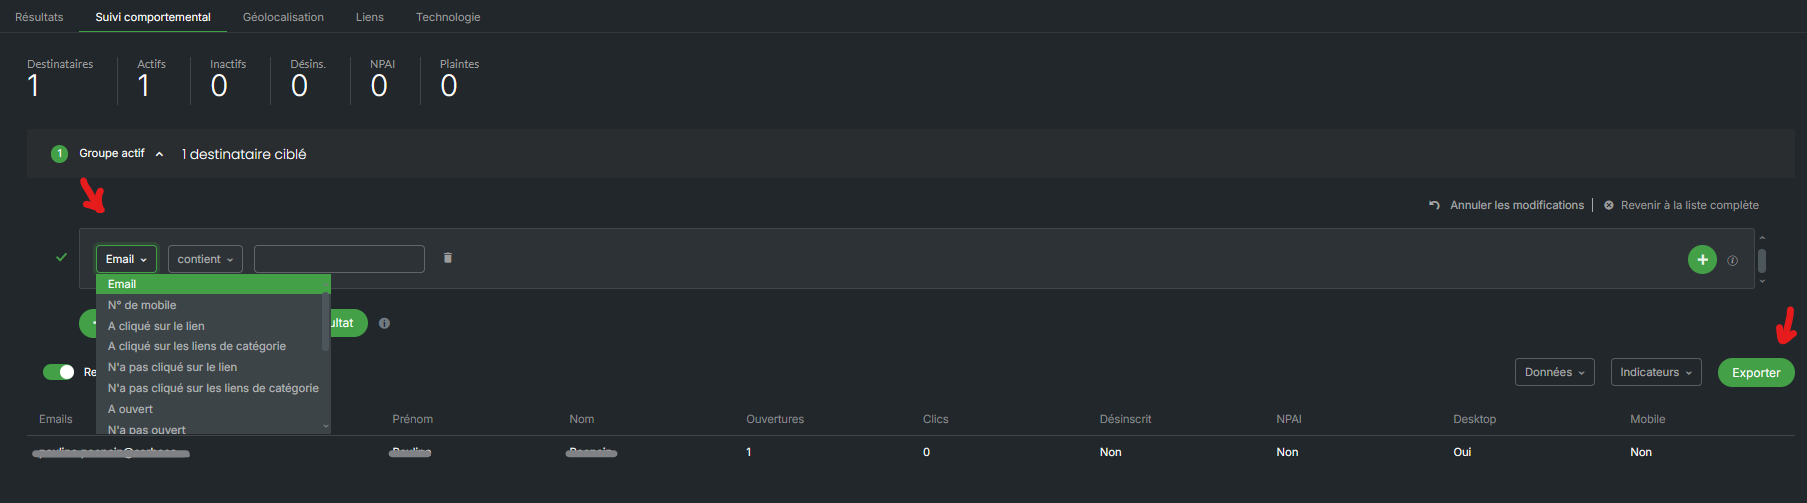
Behavioral tracking presents the actions of each recipient individually: opens, clicks, unsubscribes, and complaints.
Unlike general statistics, this data is not adjusted and corresponds only to interactions actually detected.
In this section, it will be possible to perform precise targeting according to your export requirements.
This section indicates the estimated location from which your contacts access their email. Please note that this information is provided for informational purposes only: the increasing use of VPNs may make the detection of actual location imprecise or even inaccurate.
This tab allows you to view the number of clicks made on your campaign links in detail. You will also be able to visualize the Heatmap (heat map) which displays your email by highlighting the most clicked links. It allows you to quickly visualize the areas that attract the most attention and optimize the layout of your content.
Beyond open and click rates, it is possible to know how your recipients read their emails: via a webmail (Gmail, Outlook.com) or an installed application (Outlook desktop, Apple Mail), and from a computer or a mobile device. This data is collected through an invisible pixel integrated into the email.
A limitation to know: this data is not always 100% reliable. Features such as Apple's Mail Privacy Protection sometimes distort detection, hence the appearance of categories such as "Other clients" or "Other OS" when the exact information could not be identified. VPNs can also block this information. It is a complementary indicator, useful for refining your design and strategy, but should be interpreted with caution.
It is recommended to analyze several indicators together rather than focusing on a single one.
For example:
a good open rate but a low click-through rate may indicate that the subject line is attractive, but the content or calls to action are not sufficiently convincing;
a low open rate may be linked to an unengaging subject line, an unsuitable sending time, or deliverability issues;
a high unsubscribe rate may reveal a sending frequency that is too high or content that no longer meets the expectations of recipients.
Regular analysis of these statistics will allow you to adjust your email subject lines, your content, your sending times, and your segmentation in order to progressively improve the performance of your campaigns.
